



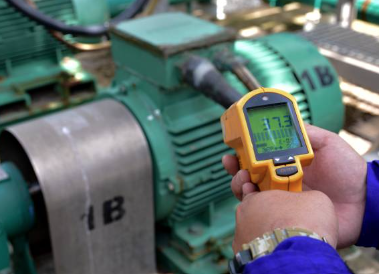
Introduction to Vibration Analysis for Predictive Maintenance
Vibration analysis is one of the most cost-effective technologies in predictive maintenance. For oil-filled power transformers, vibration testing takes only minutes, requires no outage, and costs far less than Sweep Frequency Response Analysis (SFRA). For rotating equipment—motors, pumps, and fans—vibration monitoring can detect unbalance, misalignment, bearing wear, and mechanical looseness weeks or even months before failure. This guide covers the fundamentals of vibration analysis, sensor selection, transformer-specific applications, data interpretation, and how it works alongside oil analysis.
1. What Is Vibration Analysis and Why It Matters for Predictive Maintenance
Every rotating machine and energized apparatus produces vibration while running. A healthy machine has a distinct “vibration signature” a stable pattern of frequencies and amplitudes. As internal components degrade, that signature changes. The core task of vibration analysis is to capture those changes and determine their root cause.
Unlike traditional calendar-based maintenance (replacing parts on a schedule) or run-to-failure maintenance (fixing things after they break), predictive maintenance decides when to act based on actual equipment condition. Vibration analysis has become the preferred predictive technology because:
- Early detection capability: Bearing defects, gear wear, and winding looseness can be identified in the vibration spectrum weeks before catastrophic failure
- No outage required: For transformers, vibration data can be collected while the unit is energized and at full load
- Diagnostic precision: Different fault types produce characteristic frequencies, allowing precise localization of the problem
2. Vibration Sensor Types and Selection Guide
Choosing the right sensor is the foundation of successful vibration monitoring. Three sensor types dominate industrial applications:
Accelerometers
Accelerometers are the workhorse of industrial vibration monitoring, converting mechanical motion into an electrical signal proportional to acceleration. Among these, IEPE (Integrated Electronics Piezo-Electric) sensors are the industry standard, with a built-in charge amplifier that outputs a standardized voltage signal compatible with virtually any IEPE interface module.
- Piezoelectric accelerometers: Wide frequency response, high sensitivity, rugged construction—suitable for most industrial environments
- MEMS accelerometers: Cost-effective, suitable for less demanding applications
A standard 5 kHz bandwidth sensor covers 90% of industrial fault types, including unbalance, misalignment, looseness, and late-stage bearing wear.
Velocity Sensors
Velocity sensors measure vibration velocity directly and are particularly sensitive to the mid-frequency problems common in rotating machinery.
Proximity Probes (Eddy Current Probes)
Used to measure shaft displacement relative to the bearing housing, these sensors are essential for shaft motion monitoring on large steam turbines, compressors, and other critical machines.
Installation tips: Mount sensors as close as possible to the bearing load zone; ensure the surface is clean, flat, and free of thick paint; for the highest frequency response, bolted mounting or industrial epoxy bonding is recommended—magnetic bases are convenient but attenuate high-frequency signals.
3. Transformer Vibration Analysis: Unique Value and Methods
Why Transformers Need Vibration Monitoring
The core and windings inside a transformer must be firmly clamped during manufacturing to withstand the enormous electromagnetic forces present during short-circuit faults or switching surges. Over time, however, moisture or heat causes the insulating pressboard to shrink, clamping pressure drops, and the core and windings begin to loosen.
If this looseness goes undetected, it can lead to:
- Progressive winding deformation and reduced short-circuit withstand capability
- Increased risk of partial discharge
- Eventual catastrophic failure
IEEE PC57.141 specifically addresses winding deformation detection in oil-filled transformers above 66 kV, with vibration testing as a core method. China’s DL/T 1540—2026 standard likewise specifies vibration measurement methods for oil-immersed transformers rated 110 (66) kV and above.
Practical Transformer Vibration Data Collection
Based on EPRI (Electric Power Research Institute) transformer vibration research dating back to 1992, only 8 data points are needed per transformer:
- Start on the high-voltage side (arbitrarily designated Side 1) and move counterclockwise
- Take two measurement points on each tank wall
- Exact locations depend on whether the transformer is core-form or shell-form
- Use a magnetic-base accelerometer to collect data—a normal core-form transformer can be completed in just 4 minutes
For pump vibration data, collect in the axial plane only, focusing on thrust bearing problems.
How to Interpret Transformer Vibration Spectra
A healthy, tightly clamped transformer has an ideal spectral signature:
- 120 Hz pressure wave as the dominant frequency: This is twice the 60 Hz line frequency. Each 60 Hz positive-negative alternation produces one 120 Hz pressure wave that travels through the core, clamps, and oil to the tank wall
- Harmonics of 120 Hz are also detected
- Energy is concentrated at the fundamental and its harmonics
Signs of core or clamp looseness: Frequency shift matters more than amplitude. Early methods focused only on amplitude (inches per second), but later testing showed that frequency shifts point to core and winding looseness, regardless of whether amplitude changes.
When the vibration spectrum indicates looseness, SFRA (Sweep Frequency Response Analysis) can serve as an offline confirmation method. But vibration analysis’s advantage is clear: minutes to complete, no outage required, and far lower equipment cost.
The Supporting Role of Sound Level Analysis
Sound level readings correlate with vibration analysis results. Only 4 readings are needed per transformer, one per side, at a distance of 6 feet (1.8 meters) from the transformer, using C-weighting.
4. Rotating Equipment Vibration Analysis: Fault Diagnosis Fundamentals
The core of rotating equipment vibration analysis is frequency analysis converting time-domain signals into frequency-domain spectra via FFT to identify characteristic frequencies.
Rotating Equipment Vibration Analysis
| Fault Type | Characteristic Frequency | Key Indicator |
| Unbalance | 1× RPM | Radial vibration dominant, usually largest horizontally |
| Misalignment | 2× RPM (sometimes 1×) | Pronounced axial vibration |
| Mechanical looseness | 1× RPM and harmonics | Horizontal dominance, unstable phase |
| Rolling bearing defects | BPFO/BPFI/BSF/FTF | High-frequency impacts, requires envelope analysis |
| Gear problems | Mesh frequency and sidebands | Impact patterns in time waveform |
| Resonance | Natural frequency | Sudden amplitude amplification, speed-dependent |
Structural looseness typically appears as a radial 1× RPM signal, with horizontal readings dominating. Measurements should cover anchor bolts, baseplate, and foundation to determine amplitude and phase changes.
Resonance occurs when an operating frequency coincides with a machine structure’s natural frequency, amplifying vibration levels and accelerating equipment degradation. Resonance problems often appear suddenly after a speed change or structural modification.
Data Analysis Techniques
- Time waveform analysis: Reveals impacts and intermittent problems
- Frequency domain analysis (FFT): Identifies specific frequency components
- Trend analysis: Tracks vibration parameters over time to assess degradation rate
- Envelope analysis: Dedicated to bearing fault diagnosis
- Phase analysis: Locates unbalance and misalignment issues
Critical warning: Moving a measurement point by half an inch can severely compromise trend accuracy. Once a measurement location is established, it must remain consistent.
5. Synergy Between Vibration Analysis and Oil Analysis
The Role of Oil Analysis in Transformer Monitoring
Transformer oil serves a dual function: insulation and cooling. Oil degradation moisture ingress, rising acid number, dissolved gases directly threatens transformer life.
Key oil tests and their thresholds:
| Test | Ideal Level | Concern Level | Action Required |
| Moisture content | <50 ppm | 50–100 ppm | >100 ppm, address immediately |
| Breakdown voltage | >30 kV | 20–30 kV | <20 kV |
| Total Acid Number (TAN) | 0.1–0.3 mg KOH/g | — | >1.0 mg KOH/g |
Dissolved Gas Analysis (DGA) is the most critical oil test. Characteristic gases point to specific fault types:
- Hydrogen: Partial discharge
- Methane: Overheating or thermal degradation
- Acetylene: Arcing or severe electrical faults
Vibration + Oil: Complementary Monitoring Systems
For transformers, vibration analysis and oil analysis are not competitors—they are complementary:
- Vibration analysis: Real-time reflection of mechanical integrity core clamping force, winding looseness
- Oil analysis: Reflection of insulating system chemical health moisture, acid number, dissolved gases
Condition monitoring service providers such as Wear Check have integrated vibration analysis, DGA, infrared thermography, and ultrasonic testing into complete condition-based maintenance (CBM) programs. This multi-technology approach provides a more complete equipment health picture.
For rotating equipment, oil analysis (wear particle detection) and vibration analysis are similarly complementary: vibration identifies mechanical fault symptoms, while oil analysis confirms wear type and severity.
6. A Five-Step Framework for Building a Vibration Monitoring Program from Scratch
Step 1: Asset Criticality Ranking
Not every machine needs monitoring immediately. Rank by risk:
- Tier 1 critical assets: Downtime stops production (main extruder, cooling tower pump)
- Tier 2 semi-critical: Have backups but create pressure
- Tier 3 auxiliary equipment: Easily replaced auxiliary fans or pumps
Recommendation: For first deployment, select 3–5 problem assets—Tier 1 machines with a history of unexpected failure—to validate ROI fastest.
Step 2: Choose Hardware
Modern solutions should use wireless IIoT sensors as the standard. Ensure sensor bandwidth covers the equipment’s fault frequency range.
Step 3: Determine Monitoring Frequency
Manual collection is limited by labour cost, typically allowing only monthly or quarterly routes. But a bearing can go from “early wear” to “catastrophic seizure” in just weeks, completely escaping the window of a monthly check.
The advantage of wireless IIoT sensors is that sampling rates can be set according to the P-F interval (the time between when a potential failure becomes detectable and when it becomes functional failure):
- High-speed critical equipment: Once per hour
- Standard auxiliary equipment: Once every 4–12 hours
- Event wake-up capability: Low-frequency heartbeat collection normally, wakes immediately when vibration exceeds threshold
Step 4: Data Integration and Open Protocols
Avoid vendor lock-in. Prioritize solutions that support open protocols such as MQTT and HTTP, allowing data to flow freely to your own SCADA, AWS, Azure, or Google Cloud.
Step 5: Personnel Training
A successful vibration program requires:
- Technicians: Measurement methods, safety procedures, basic data interpretation
- Analysts: Vibration theory, diagnostic techniques, advanced analysis training
Industry-recognized Category I (CAT I) vibration analysis certification (such as IRD Mechanalysis) is strong evidence of team competency.
7. Practical Advice and Common Pitfalls
Practical advice:
- Transformer vibration measurement point location is critical and must be collected by experienced personnel—locations differ between core-form and shell-form designs
- Watch frequency changes, not just amplitude—frequency shift is the early signal of transformer looseness
- Trends are more valuable than single readings—establish a baseline and track the rate of change
- Vibration sensor mounting quality determines data quality—secure attachment is a prerequisite
Common pitfalls:
- High vibration means shut down immediately” → Judge based on frequency signature and trend
- Normal oil analysis means no mechanical problems” → Oil and vibration reflect different health dimensions
- All equipment can use the same monitoring frequency” → Differentiate by P-F interval and criticality
Conclusion
The core value of vibration analysis for predictive maintenance is finding faults before they become visible. For transformers, vibration testing offers unique energized, fast, low-cost detection of core and winding looseness, perfectly complementing the insulation diagnostics provided by oil analysis. For rotating equipment, vibration analysis is the most mature early fault detection technology available.
Success depends not on buying the most expensive hardware, but on a systematic approach: sensible asset ranking, correct sensor selection and installation, monitoring frequency matched to criticality, and well-trained personnel. Start with 3–5 critical machines, build experience and baseline data, then expand incrementally—this is the most cost-effective deployment path.